Introduction
The ISO 15189 standard for medical laboratories serves as an inevitable tool for providing requirements for competence and quality in biochemistry laboratory.
In every laboratory it is of outstanding importance to ensure internal quality control (IQC) as well as to be included in external quality assurance schemes (EQAS). If laboratories accredited according to ISO 15189 standard have two or more different analyzers or procedures for examinations, they should define mechanism for comparison of those results (1). The comparability of different analytical systems minimizes analytical bias and enables comparison of individual test results with the population values based reference interval or with cut-off value (2). It also provides fast and reliable results reporting in laboratory, especially in emergency department, regardless to the analytical system which is used and functional. This ensures the best patient care and is key point for continuous improvement of laboratory accredited according to ISO 15189 standard.
The objective of this study was to describe the model for comparison of emergency tests on two different types of automated analyzers used in laboratory on daily basis.
Materials and methods
Setting
University Department of Chemistry is the laboratory accredited according to ISO 15189 standard since 2007. It is the department of Sestre milosrdnice University Hospital in Zagreb, Croatia, which is tertiary care medium-sized hospital. In laboratory, approximately 30.000 samples per month is admitted, out of which 11.000 emergency samples with general biochemistry tests. On daily basis there are about 350 emergency samples with biochemistry tests.
Laboratory has two types of clinical chemistry analyzers for performing general biochemistry tests: Olympus AU2700 and Olympus AU640 (Olympus, Hamburg, Germany). Olympus AU2700 was used as the reference analyzer while the other, Olympus AU640, was used as a continuous backup system for the reference analyzer.
Samples
Comparability is assured on daily basis for the following serum analyzes: total and conjugated bilirubin, glucose, creatinine, urea, total protein, enzymes (AST, ALT, LDH, CK, CK-MB and a-amylase), potassium, sodium, chloride, calcium, C-reactive protein (CRP). Comparability is also assured for amylase and glucose in urine.
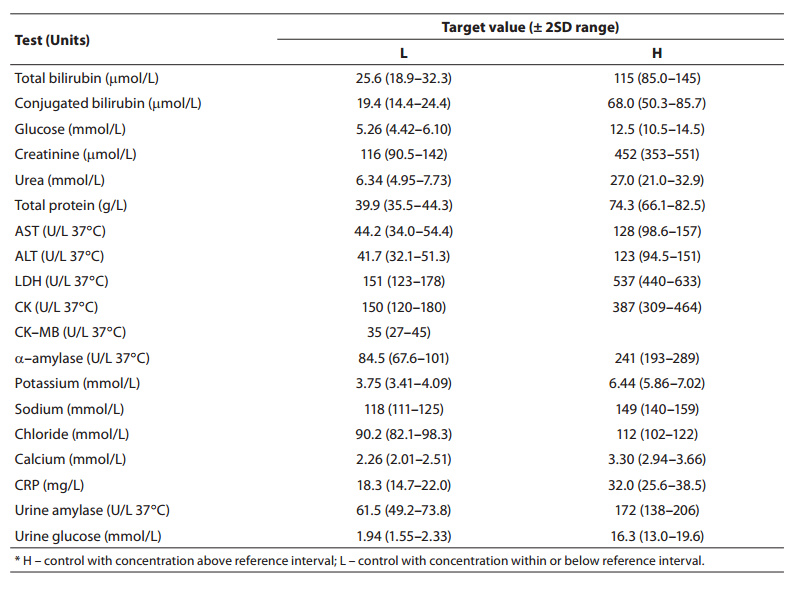
During the period of 60 days internal quality control procedures were continuously performed on two levels with two different analyzers. For determination of CRP concentration commercially available controls ITA Control serum level 1 and 2 (Olympus, Hamburg, Germany) were used, for urine amylase and glucose commercially available Urine chemistry control 1 and 2 (Bio-Rad Laboratories, Irving, CA, USA) and for CK-MB commercially available CK-MB Kontrola (Herbos Dijagnostika, Sisak, Croatia). For all other tests Control serum 1 and 2 (Olympus, Hamburg, Germany) were used. Target control values for all control samples are listed in Table 1.
Table 1. Control sample target values with acceptable range.
Comparability assessment
Comparability was assessed by calculation of the test concentration bias according to the following equation:

where bias represents a measure of agreement between reference and backup analyzer, conc. means concentration of the particular test, AU2700 or AU640 indicates type of analyzers: Olympus AU2700 or Olympus AU640. Result was multiplied with 100 to obtain the percentage value.
Maximum allowable biases for all tests were defined according to the values of the coefficient of variation (CV) for particular parameter given by the Croatian Society of Medical Biochemists external quality assessment criteria.
Workflow for the results comparison
All control samples were measured on both analyzers (Olympus AU2700 and AU640) on daily basis. Every control sample result was plotted on the Levey-Jennings chart and checked for acceptability according to Westgard rules (target value ± 2 standard deviations (SD)) (3,4). If control sample test results were acceptable on both levels, they were entered in the model for analyzer comparison. If results were not within acceptable range, IQC procedure should be re-run with fresh control samples. Analyzes with results outside acceptable range should be calibrated and IQC procedure performed again. When control values on both analyzers fulfilled required IQC criteria and are within acceptable bias, routine work could be proceeded. If control values are not comparable, medical biochemists should check if their difference is clinically significant in comparison to inter-individual biological variations according to Westgard (5). If the difference is not clinically significant, routine work may be continued. For tests with difference above inter-individual coefficient of variation (CV), control samples should be re-run or test calibrated (Figure 1).
Figure 1. Workflow for internal quality control and results comparability on two different analyzers. AU2700 – Olympus AU2700; AU640 - Olympus AU640; IQC – internal quality control
Results
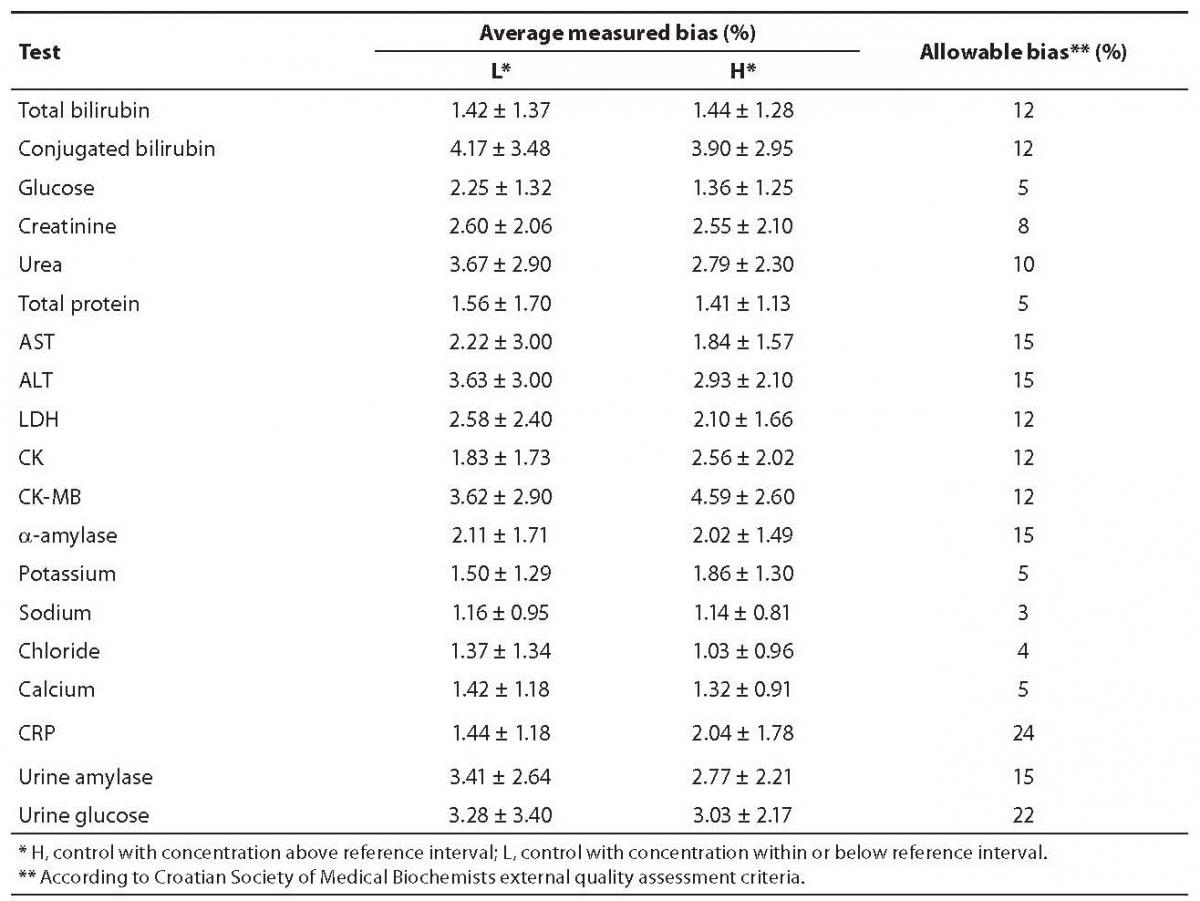
Average 60-day period bias was within acceptance criteria for all analyzes included in this model of comparability assessment (Table 2). Only low control concentrations for bilirubin, chloride, glucose, potassium, sodium, creatinine and urea were exceeding allowable biases in less than 2% cases, though those exceeding values were not clinically significant and as such were disregarded. Control samples with high concentration were never exceeding allowable biases. Conjugated bilirubin concentration in the low control level had the largest 60-day period average (4.17%) and maximum bias (16.48%). The minimum average bias was observed for sodium (1.16%).
Table 2. Average measured biases for low and high concentration control samples with allowable bias values.
Discussion
Laboratories accredited according to ISO 15189 standard have to provide quality test results and also test reports in assigned turn-around time (TAT) which is 1 hour for emergency tests. This TAT could be accomplished by the two analyzers both available and functional with comparable results between themselves.
The aim of this study was to describe the model implemented in laboratory which is a mechanism for continuous verification of results comparability on two different automated analyzers. This verification was performed on daily basis, defined due to characteristics of the emergency test procedure.
To the best of our knowledge this is the first published example of the model for ensuring the comparability of two automated analytical systems.
For allowable biases of backup toward reference analyzer, CVs defined by the Croatian Society of Medical Biochemists external quality assessment criteria were used. Those criteria include biological variation and represent the total allowed bias from the mean value (5).
The key finding of this study is that a simple algorithm could ensure continuous comparability and reliability of emergency test results and constant preparedness of two analyzers. The presented model provides fast switch from one to another analytical system due to possible turndown episode of reference analyzer.
One of the principal quality indicator in accredited laboratory is ensuring reliable and accurate results from the samples with appropriate interpretation. This model could measure laboratory performance and also provide the most accurate results (6), regardless on which automated system samples are determined. In this way, laboratory can greatly contribute to patient diagnosis and provide the important part of the patients’ best health care. If laboratory results are not comparable from different analytical systems, possibility for incorrect diagnosis and poor quality of patient care is increased (7,8).
This model also provides a trustful basis for ensuring longitudinal patients follow up. Thereby, model is one of the way for laboratory process and emergency test reports standardization (9).
Although the most laboratory errors are preanalytical or postanalytical phase (10), analytical errors due to system failure could be avoided with two equally ready and functional analyzers. The described model for comparability could reduce analytical phase errors occurred due to some failure of the reference analyzer.
This model of results comparison ensures continuous analytical quality of laboratory reports and improves overall efficiency of laboratory services. Reliable and comparable results on daily basis provide high quality of examination procedures and reporting of results in recommended and appropriate time to the best of the patient care.